Atrium
Bütün çevrimiçi Atradius uygulamalarına tek bir ortam üzerinden erişim sağlayabileceğiniz yeni çevrimiçi platformumuz Atrium'a buradan ulaşabilirsiniz.

 Türkiye
 Almanya
 Amerika Birleşik Devletleri
 Avustralya
 Avusturya
 Belçika
 Birleşik Arap Emirlikleri
 Birleşik Krallık
 Brazil
 Bulgaristan
 Çek Cumhuriyeti
 Çin
Çin
 Danimarka
 Finlandiya
 Fransa
 Hindistan
 Hollanda
 Hong Kong
 İrlanda
 İsveç
İsveç
 İsviçre
 İtalya
 Japonya
 Kanada
 Litvanya
 Macaristan
 Meksika
 Norveç
 Polonya
 Portugal
 Romanya
 Singapur
 Slovakya
 Slovenya
 Spain
Türkiye
Spain
Türkiye
 Yeni Zelanda
 Yunanistan

The latest World Energy Outlook 2025 from the International Energy Agency (IEA) marks a worrying turning point in the global energy debate. For the first time in years, the pessimistic Current Policies Scenario (CPS) is back on the table, signalling a slowdown in the energy transition and later peaks in fossil fuel demand. Even in the Stated Policies Scenario (STEPS), oil prices are projected to remain structurally higher than last year’s outlook, while the Net Zero Emissions (NZE) pathway of steadily declining fossil fuel prices seems further out of reach than ever.
These are clear signals that the world is not on track to achieve its climate goals. However, for economies that rely heavily on fuel imports, this is more than a climate challenge. It is a matter of energy security and economic resilience, and it should serve as a wake-up call. As these countries can no longer count on a downward trend in global oil and gas prices to ease their fuel import bills, the need to accelerate investment in domestic renewable energy sources has become more urgent. The recent oil and gas price hikes because of the war in the Middle East illustrate this vulnerability. Yet the impact of expanding renewable power on fuel import dependence is constrained by the slow electrification of industry and heavy transport, alongside persistent bottlenecks in securing affordable financing.
This report examines where fuel-importing countries currently stand, the risks they face as the energy transition slows, and what is needed to reduce their economic exposure to future price shocks. We start by outlining the state of the energy transition, drawing on the latest IEA’s scenarios and recent developments that shape its trajectory and, building on that, we briefly discuss the key bottlenecks that continue to slow progress.
With heatwaves, extensive wildfires, severe droughts, strong winds and heavy precipitations, climate change was continuing to impose itself as we documented the state of the energy transition for our April 2025 Energy Outlook. That gave a rather dire picture. With the US withdrawing from the Paris Agreement the global focus was shifting towards geopolitics at the moment the transition badly needed a boost. The 2024 UN Climate Change Conference (COP 29) in Baku failed to deliver convincing results with respect to financing of the transition in emerging and developing economies. A fundamental shift seemed to have happened.
Almost a year on, this view is reinforced. The US has withdrawn from the foundational climate treaty UNFCC, pledging a return to fossil fuels. The rest of the world, even without the US, highlighted its disarray in climate affairs during the COP 30 in Belem late last year. A multilateral agreement on contentious issues like the future of fossil fuels, the reduction of methane emissions, and the challenge of financing the energy transition in emerging and developing economies simply proved unattainable. Meanwhile, carbon dioxide (CO2) emissions reached a record high in 2025, a year that is in the top three of the hottest years on record. It paints a bleak picture.
Against this backdrop it comes as little surprise that the IEA 2025 Energy Outlook brings an old pessimistic scenario, the CPS, back to the forefront. It stands alongside the more optimistic (but still insufficient to really fight climate change) STEPS that we have used as the benchmark in our April 2025 Energy Outlook. The pathway to the Paris Agreement goal of limiting warming to 1.5 degrees Celsius, and at most 2 degrees, represented by the NZE scenario, completes the set of directions the world can move into.
At the current juncture, the NZE scenario, seems further away than ever since we started our Energy Outlook series. At the same time, we think the CPS scenario where only policies and regulations that are currently in place accompanied by a very cautious view on the speed of deployment of new energy technologies is taken, is – still – too pessimistic. STEPS therefore remains our preferred scenario, which we benchmark against the CPS. In this way we rely on a broader range of policies, including the ones put forward but not yet adopted, with barriers to introduction of new technology lower than in CPS.
Even this more optimistic STEPS view, which differs only marginally yet meaningfully from the CPS, gives nothing to cheer about. By 2100 in STEPS the world will have reached an average temperature increase of 2.5 degrees Celsius, against the CPS coming out at 3 degrees. If one considers these figures against the current level of 1.47 degrees on average, one can imagine what further warming means for climate change in the upcoming decades. It is only the now much touted, but increasingly distant, NZE scenario that controls such climate damage, though even under this pathway there will be decades of higher temperatures before the temperature rise settles at 1.5 degrees in 2100.
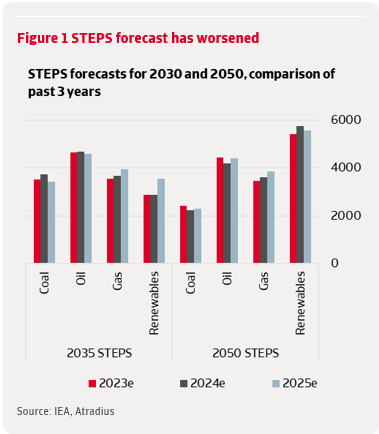
It is not only the direction that the world is moving into. There is also the worsening of our preferred STEPS scenario since our April Outlook as such, in the sense that more fossil fuel is needed in the energy mix (see figure 1).
Natural gas consumption is also up due to the use of gas for transport, notably for vehicles in China and for shipping as well as for industry in emerging and developing economies. After this series of negative revisions, there is at least one noteworthy upside: EV projections in other regions than the US have been revised upward. Particularly in China there are 20% more EVs expected on the road in 2035.
The energy transition is unrolling through three channels: energy efficiency, electrification and the move away from fossil fuels. Underlying the process are three driving factors: government intervention, public and private investments and technological progress. These factors should generate an economically compelling case for clean energy, whereby fossil fuels are driven out of the market – at least as much as energy demand allows. Investments play a pivotal role in this. These should generate the new energy supply capacity that can accommodate rising energy demand. The current picture of energy investments is not very encouraging, both in terms of scale and distribution.
Scale-wise, in 2024 worldwide energy investments exceeded USD 3.2 trillion and are estimated to reach USD 3.3 trillion in 2025. This will only rise marginally in STEPS, remaining stable in CPS, until 2035. There are various reasons for concern that underpin this picture. Energy efficiency as such is slowing, from on average 2% per year in 2010- 2019 to 1.1% in 2024. While end-use efficiency is rising, notably for EVs, investments in technical efficiency improvements that help more efficient housing stock or equipment is flatter. Insufficient efficiency standards and lack of stringency in these are also playing a role. Moreover, grids and other investments in electricity security is out of balance with spending in the power sector overall, creating bottlenecks. Ten years ago, the spending on transmission and distribution networks was 60 cents for every dollar spent on generation, now it is only 40 cents. Slow permitting processes and tight supply chains for components reinforce this. Lastly, we also only see limited change in the level of investments for oil and gas, which in STEPS is only marginally lower than the recent average spending of USD 825 billion, and in the CPS even higher at USD 890 billion to meet the higher demand in that scenario.
Besides the level, the distribution of the investments is also a concern. Indeed, the largest gaps in energy investments are in emerging and developing countries, except for China. These countries, and in particular countries like India and Indonesia, are the primary drivers of energy demand growth until 2035 (and beyond). The main bottleneck is financing of the increasing need for energy infrastructure. Africa, where energy demand is growing fastest, is a case in point with current spending levels about 30% below recent levels. Underlying this development is the perceived risks in these countries, driving up financing costs.
While energy investments are the outcome of what is perceived as the direction of the energy transition, the process as such has two underlying determinants: government intervention and technological progress. Take government intervention first, which is the policy framework for the scenarios. The IEA tracks the developments in this field, and progress comes nowhere near what is needed for the Paris Agreement Goal. Positively, it signals major new policy measures have been taken in 48 countries, from energy performance standards for vehicles to government financial incentives and pricing schemes. New targets for clean power generation were set in a number of countries, including Korea, Japan, Indonesia and Vietnam, as well as the EU. Nigeria, Morocco and Malaysia set new targets for air conditioner efficiency. New incentives for EVs and its infrastructure were set for example in Nigeria and India, while Australia implemented a fuel efficiency standard as Indonesia improved biodiesel blending rules. The EU announced upgraded emission trading and support schemes for the industry.
But that is about the only good news there is. In the US, the largest economy in the world, the federal government is focusing on removing obstacles to development and use of domestic oil, natural gas and coal. At the same time, it rolls back efficiency measures, just like support for wind, solar power and EVs. This is embodied in the One Big Beautiful Bill Act, marking a fundamental change to the Inflation Reduction Act that focused on clean energy. With global leadership lacking, the submission of the Nationally Determined Contribution (NDCs), due in February 2025, turned out to be a flop. No less than 95% of the countries missed the deadline, a figure that improved to 55% towards the COP30 in Belem. None of this is helping to improve the outlook under STEPS, let alone CPS.
The picture is a little more positive for technological progress, as captured by the cost of various clean technologies (versus those of fossil fuels). Critical mineral prices and supply chain problems have pushed up the cost of clean energy early in the decade, but since then they have fallen. Indeed, the IEA Clean Energy Equipment Price Index reached its lowest level ever in 2024 largely as a result of price reductions in batteries (used for EVs) and solar PV, reaching 80% over the last decade. Underlying lower battery prices, especially in China (-30% in 2024) and to a lesser extent in the EU and US, are fierce competition as well as economies of scale and major declines in lithium, cobalt, nickel and graphite prices. It triggered rapid adoption of this technology. Solar prices likewise reached historic lows in 2024 – almost 45% below 2023 – as cost of panels fell. Like with batteries, intense competition and significant overcapacity – especially in China – is at the heart of it. This situation is likely to last going forward, maintaining downward pressure on prices. Less cost pressure is seen in wind turbines, where prices only fell by 2%. Manufacturers kept prices relatively high to counter profitability pressure from past years.
This picture of technological development, which is a little more rapid in STEPS compared to CPS, supports the business case for clean energy. It suggests that the slowdown in the energy transition is much more a matter of insufficient or inverse government intervention and, closely related, lack of investments. It reflects clearly the way the energy transition is expected to unfold, in STEPS, let alone CPS. While STEPS and CPS differ in assumptions, in some respects they reveal similar outcomes.
In both scenarios, the energy demand grows as emerging markets become richer and their population demands more energy services. In STEPS energy demand growth until 2035 is 8%; in the CPS 14%. This is due to stronger efficiency policies, reducing overall energy demand, and more energy efficient electricity generation and transport. Nearly all the increase in energy demand is coming from emerging and developing economies, rising 15% in STEPS and 20% in the CPS. While China’s demand clearly matures, demand in India, Southeast Asia and other emerging economies accelerates.
Electricity plays an increasingly important role in energy demand growth, powered by advanced manufacturing, higher value-added services, EVs, the digital economy and AI. Demand for electricity grew twice as fast as overall energy demand. In STEPS and CPS, electricity demand rises to similar levels by 2035, 40% higher than today. But in STEPS the electrification of end uses in transport and heating proceeds faster, compounded by higher efficiency gains. In CPS, therefore, more energy demand remains to be satisfied by other fuels. Electricity generation by renewables, moreover, is speeding up faster in STEPS than in the CPS, reaching 55% by 2035 from about 30% now. In CPS, the lack of policy support and grid bottlenecks pose more challenges, depressing growth in the use of renewables. Demand for fossil fuels is moving in the right direction in STEPS, reflecting faster electrification and more use of renewables, while in CPS it continues to rise. In STEPS, the additional renewable capacity in emerging and developing countries is sufficient to lower coal demand for electricity generation into 2035. This is also projected in the CPS, but at a later stage. Road transport is the main determinant for global oil demand, with a share of 45%. Therefore, electrification of transport, by internal combustion vehicles (ICEs) and EVs, is a major determinant. In STEPS the share of EVs in total car sales doubles to 2030 and gets to 50% by 2050. In the CPS EV sales plateau after 2035 and ICEs grow only by historical trends. Oil demand therefore declines in STEPS, whereas it continues to grow in the CPS. This picture of diverging price paths is also visible in for natural gas. In STEPS renewables moderate the growth of gas figured power plants, lowering gas demand in the advanced economies in Europe and Asia. The result is an increase of 10% by 2035, after which decline sets in. Again, in the CPS with renewables and other sources of energy generation taken up more slowly, the demand for gas rises by more than 15%. Moreover, it continues to grow afterwards.
So, while climate is insufficiently contained, the energy transition towards renewables, away from fossil, is slowing, in STEPS and even more in the CPS. This has important implications for fossil fuel importers, in advanced as well as emerging and developing countries. Especially the emerging and developing ones that we focus on in this report are facing a double-edged sword. Often more vulnerable to climate change, with droughts, precipitations, winds and heat more prominently affecting them, and their resilience weaker, compared to advanced economies.
Climate change therefore hits them harder. Moreover, with the changes in the energy transition outlined above, their import bills will be affected in a negative sense. This is because fuel prices will remain higher for longer, in STEPS and even more pronounced in the CPS.
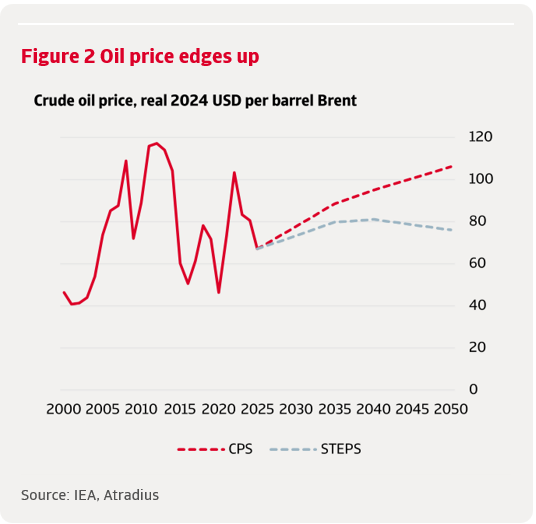
Oil prices edge up somewhat in STEPS compared to our 2025 Outlook. The reason is that, with the energy transition slowing, more oil is needed. That can only be extracted at higher costs, which need to be reflected in higher prices as otherwise the market will not balance. They end up at USD 80 per barrel in 2035, after which they will ease. In the CPS, where even more oil is needed, prices will be significantly higher, ending up at USD 89 per barrel in 2035, after which they will go even higher.
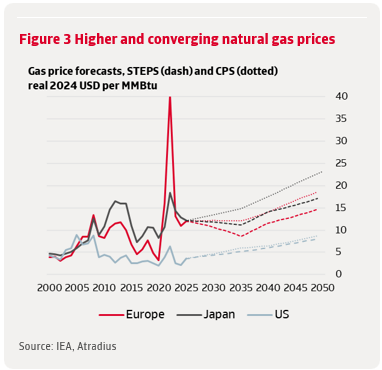
Natural gas prices paint a somewhat similar picture, at least in STEPS. The main development here is the large wave of LNG capacity that is coming to the market, from the US, Qatar and Canada. This cannot all be immediately absorbed by growing demand. The result is that European and Asian (Japan) prices go down, whereas the US Henry Hub benchmark goes up, from a very low current level. In the CPS the demand for gas is higher, which will reflect in more outspoken price movements: the US benchmark higher and the European and Asian ones only slightly below current levels. Therefore, much higher than in STEPS.
To assess how exposed fuel-importing economies exactly are to the structurally higher fuel prices implied by the CPS and STEPS trajectories, and how they manage the associated risks, we follow a three-step approach. First, we identify the most vulnerable countries based on their net fuel import bills. Second, we decompose the drivers of those bills over the past 15 years. And third, we look ahead with a scenario analysis to evaluate how higher fuel prices could affect their economic resilience over the next decade.
To identify which countries are most exposed to the medium-term rise in fuel prices we identify the largest fossil fuel importers using net fuel import bills of at least 4% of GDP as the threshold. Based on 2024 UNCTAD trade data, this yields 63 countries that are heavily dependent on the import of fossil fuels. This makes them financially vulnerable, as high import costs contribute to current account deficits and increase pressure on international reserves and currencies. In fact, almost 50 of these countries already run current account deficits, and in half of them the deficit exceeds 5% of GDP (see figure 3).
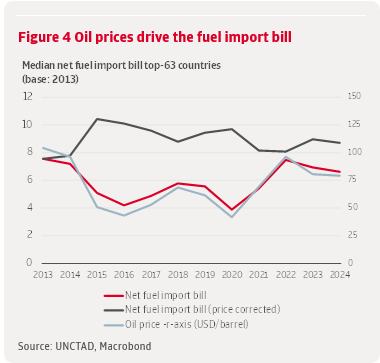
At first glance, it is already clear that oil price swings are indeed the main driver of fuel import bills and explain most of the renewed post-2021 increase of these bills. This strong price effect raises concerns if the IEA’s more pessimistic scenarios materialise. Even after adjusting for price adjustments, net fuel import bills remain high. However, we do detect a modest but noticeable structural decline in the price-adjusted series since 2015, suggesting that some fuel-importing economies have made progress in reducing their dependence on fossil fuels (see figure 4).
Before examining the specific channels behind this structural improvement, it is useful to take a look at how the group of top-fuel importers has evolved over time as its composition has shifted markedly. Several countries successfully reduced their dependence and dropped out of the group, while new fuel-intensive economies took their place. Many of these best performers – Estonia, Lithuania, Bulgaria, Slovenia, Malta, Luxembourg, Belgium, Czech Republic – are advanced economies, whereas most newcomers are emerging markets. Taiwan and South Korea are now the only advanced economies still classified by us as top fuel importers. This shift confirms the well-known link between economic development and falling fossil fuel demand. Indeed, IEA research has concluded that demand is approaching its peak in advanced economies while continuing to rise in emerging and developing economies.
The above suggests that lower energy demand that comes with economic development play a key role in helping countries reduce their fossil fuel import dependence. Yet it is not only advanced economies that have been successful in that. Several emerging economies have also managed to lower their net fuel import bills in recent years, which indicates that additional drivers are at play. Indeed, for fossil-fuel-importing economies, reducing the need for fossil fuel inputs – whether through improved energy efficiency or a shift toward cleaner energy sources – offers a great opportunity to limit exposure to volatile global fuel markets.
To assess how changes in energy use and the energy mix contribute to structural improvements in net fuel import intensity, we turn to a simple decomposition that breaks the net fuel import bill (expressed as a share of GDP) down into its underlying drivers. Instead of presenting the formulas, which are shown in the appendix, we focus here on the intuition. The first three drivers capture the underlying drivers of fossil fuel demand. So, how much energy the economy uses per unit of real output, how fossil heavy that energy mix is and how expensive imported fuels are. The fourth factor links the equation to net imports by accounting for how much of import demand is “netted away” by exports.
Together, these elements allow us to disentangle the forces behind changing fuel import dependence and to see more clearly why some economies have made faster progress than others. The decomposition is applied to a limited group of fuel-importing economies with complete data for 2009-2024, covering both advanced economies and emerging markets, with the former somewhat more represented (see country list in appendix). The results are expressed in log changes, which measure proportional changes over time and have the advantage that the contributions of each driver add up neatly to the total change in net fuel import intensity. To get a view on the impact of oil price changes, we have split the 2009-2024 periods into three periods as well, two where oil prices are rising/high and one where declining/low. The results confirm fuel prices as the dominant driver of short-term fluctuations (figure 5). Over the full period, however, structural declines in net fuel import intensity come from the other components.
Energy efficiency exerts a steady downward effect across countries and is key among countries that achieved the largest reductions in their net fuel import ratios. The sample bias toward advanced economies may reinforce this effect, but it also reflects a genuine trend. Falling energy demand – due to both economic development and efficiency gains – is the strongest structural contributor to lower fuel import bills. Economic development reduces energy demand by shifting activity from energy intensive industries toward services and by enabling the adoption of better, more efficient technologies. At the same time, efficiency gains are also evident in several emerging markets. Because efficiency delivers fossil fuel savings across the whole energy system, including sectors that electrify slowly such as industry and heavy transport, it is the most immediate lever for reducing fuel import dependence.
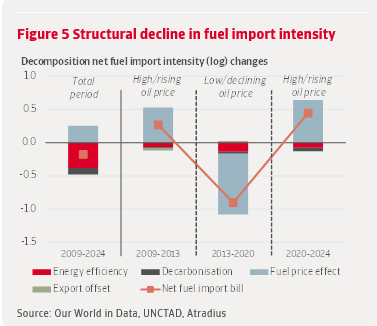
By contrast, decarbonisation effects remain modest. Because renewables are concentrated in the power sector, their impact on total primary energy is limited in countries where electrification is still low.
To make sure that the sample’s tilt toward advanced economies isn’t distorting the results, we extend the analysis to in total 70 fuel-importing countries, the vast majority of which are emerging markets (see appendix for the extended country list). For this broader sample, we use changes in the renewable share of electricity as a crude proxy for decarbonisation where data on fossil shares of primary energy are missing. It yields a similar picture. Energy efficiency remains the main structural force behind falling net fuel import bills. Its median contribution is somewhat smaller than in the previous – more limited – country sample, but it still outweighs other drivers by a clear margin. This shows that efficiency gains also play a key role in emerging markets, even if this varies across countries. The limited role of decarbonisation is also visible in the data. Fewer than half of the top 25 countries reducing their net fuel import ratios show above-median growth in renewable electricity shares, while most record above-median efficiency gains. Moreover, progress in renewable electricity would appear even more modest when viewed against total energy demand. The reason is that reductions in fossil fuel demand depend critically on electrification rates, which remain generally low.
A stylised example reflecting the upper bound of recent progress illustrates this. Given a global average electrification rate of 21%, raising the renewable share of electricity from 10% to 45% – roughly the median of the top 25 countries greening their power mix – reduces the fossil share of total energy only from 97.9% to 90.6%. This corresponds to a log change of −0.078, which is far smaller than the median efficiency effect (−0.19) and the upward price effect (+0.27) in our extended sample of 70 countries. As long as electricity remains a modest share of final energy use, even rapid growth in renewables will translate into only limited reductions in primary fossil fuel demand and therefore does relatively little to cut fuel imports. To match the median efficiency effect in this example, the electrification rate would need to simultaneously rise from 21% to around 43%, on top of the same increase in renewable electricity we assumed above. This is a substantial adjustment. But once electricity and clean power account for a greater share of the energy system, smaller incremental changes in either variable will deliver much bigger cuts in fossil-fuel demand. Because fossil energy use depends on the product of the electrification rate and the renewable share of electricity, progress in electrification and renewables reinforces each other.
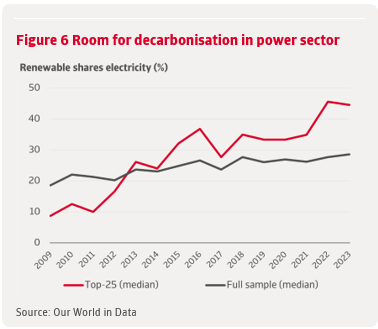
Even with electricity levels relatively low, progress can be made. This is because renewable expansion has a lot of potential and renewable expansion has so far been gradual. Across the full sample, the renewable share in power has increased only from about 20% to 30% over the past 15 years (figure 6) – indeed another reason why decarbonisation in general has had a modest impact on fuel imports so far.
While there is ample room to accelerate progress, well-known bottlenecks continue to hold many countries back, including limited financing options in emerging markets, weaker renewable energy policy frameworks, and implementation challenges noted earlier. Just as importantly, electrification must advance more quickly, both in emerging markets and in advanced economies. Moreover, where according to the World Bank, most policy efforts still focus on the electricity sector, much more attention could be directed toward heavy transport, industry, heating, and cooling as well.
Having established that fuel price dynamics and energy demand – rather than domestic renewable deployment – are the main drivers of net fuel import bills, we next take a forward-looking view to assess how these bills will evolve in the medium run in the different IEA scenarios. We use the IEA’s CPS and STEPS fuel price paths as inputs to our own scenario work, conducted with the Oxford Economics Global Economic Model. Because the model does not report fuel import bills directly, we use the current account balance as the relevant macro-economic indicator.
Among the 14 fuel-importing countries available in the model, a little over half see a deterioration in their current account balances by 2035, the end of the forecast horizon (figure 7). The deterioration is slightly larger under CPS, which is consistent with its higher projected oil and gas price paths relative to STEPS. Moreover, CPS also assumes weaker future gains in energy efficiency, amplifying the negative impact on fuel import bills and therefore on current accounts.
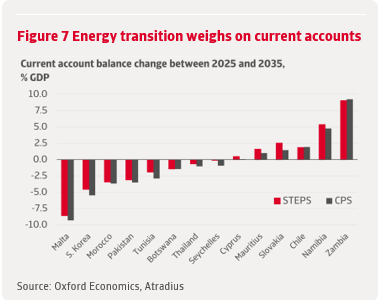
However, this overall impact is somewhat muted for this group because several countries appear able to partly offset higher fuel import costs via improvements in other components of the current account, such as stronger exports or lower non-energy imports. Others – such as Thailand, Malta, and South Korea – start with current account surpluses in 2025, which helps cushion the shock. But even if this small sample includes some favourable outliers, several economies that already run current account deficits still experience the substantial weakening one would expect under rising fuel prices. Tunisia’s deficit widens from 2.1% of GDP in 2025 to 5.1% in 2035, while Morocco’s worsens from 1.9% to 5.6% of GDP. These magnitudes are broadly consistent with what the CPS fuel price path would imply for a country with a median net fuel import bill that does not take mitigating measures.
Although increasingly distant, NZE remains the focal point for the long-term. With oil prices falling sharply to USD 33 per barrel, almost no country experiences a deterioration in its current account balance from fuel costs alone. However, as we showed in an earlier research note , even in this optimistic case, many fuel-importing countries still face persistent current account deficits due to other imports, narrow export bases or macro policy weaknesses.
The IEA’s latest outlook points to a slowdown in the global energy transition and should serve as a wake-up call, especially for fuel-importing emerging economies. Later peaks in oil and gas demand, combined with structurally higher prices, mean these countries can no longer simply count on a benign downward oil price trend to ease external pressures. So far, energy efficiency has been the main force lowering net fuel import intensity, but these gains may weaken under more pessimistic scenarios like CPS.
This makes it even more important to accelerate the development of domestic renewable energy to reduce dependence on imported fuels. Yet progress so far has been modest. In many fuel-importing countries, the renewable share of electricity has risen only gradually, leaving considerable room for improvement. Faster progress will require tackling financing barriers and other well-known bottlenecks, particularly in emerging markets.
At the same time, renewables alone cannot significantly reduce total fossil-fuel demand in the medium term, because its impact remains concentrated in the power sector. More emphasis should therefore be placed on electrifying industry, heating and heavy transport. However, the IEA’s CPS and STEPS trajectories still foresee only gradual increases in overall electrification.
Reducing macroeconomic vulnerabilities from high and volatile fuel import bills will therefore also require action beyond the energy system. Strengthening export capacity, improving competitiveness, and reducing dependence on non energy imports can help make current accounts more resilient to swings in global fuel prices. These steps will also help reduce exposure oil price shocks emanating from geopolitical events – such as the recent Middle East war – or by temporary disruptions to the energy system that may arise during the transition.
Geri arama talebi

